
The Most Splendid Housing Bubbles in America: Dollar’s Purchasing Power Swoons, January Update
San Francisco Bay Area condo prices are the glaring exception. House Price Inflation in all its glory.
By Wolf Richter for WOLF STREET.
We’re not talking about miracles, such as the same house getting bigger somehow or fancier, but about how many dollars it takes to buy the same house. According to the National Case-Shiller Home Price Index for October, released today, it takes 9.5% more dollars than it took a year ago to buy the same house, meaning that the US dollar has lost purchasing power by that much with regards to houses. This watering down of the dollar is the purposeful result of the Fed’s interest rate repression and the $3 trillion it printed and handed to the markets, which triggered, among all kinds of other peculiar phenomena, a land rush.
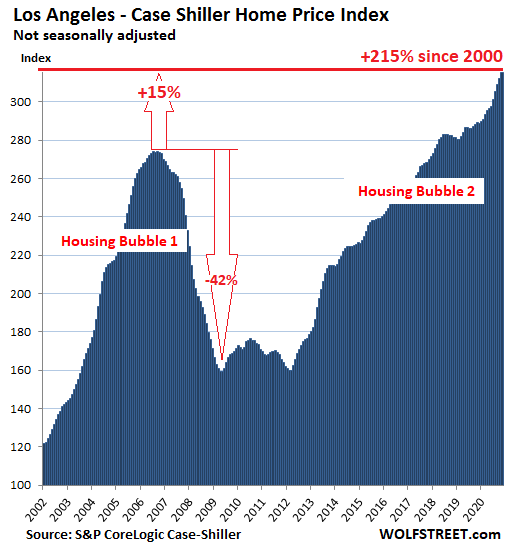
Los Angeles – the #1 most splendid housing bubble:
The Case-Shiller Index for house prices in the Los Angeles metro rose by 0.9% in November from October and by 9.1% year-over-year, with prices now exceeding the peak of the insane Housing Bubble 1 by 15.1%. The index was set at 100 for January 2000 across the 20 cities it covers. So the index value for Los Angeles of 315 indicates house prices in the metro have surged by 215% since January 2000 – meaning they more than tripled in 20 years – thereby making Los Angeles the most splendid housing bubble on this list.
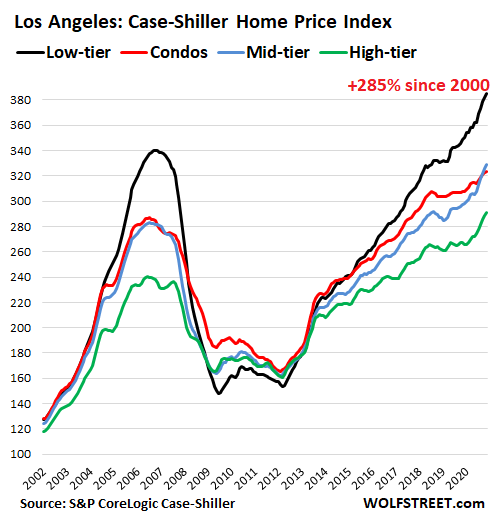
For Los Angeles, along with a few other cities, the Case-Shiller Index provides not only an index for house prices, but also separate indices for prices of condos, and high-, mid-, and low-tier houses. In Los Angeles, they have diverged, with prices of houses in the low tier (black line in the chart below) nearly quadrupling since 2000 (up 285%), and with houses in the high tier (green) surging the least. Condos (red line) are in the middle.
Compared to November last year, prices of mid- and high-tier houses have surged the most (+10.4% and +10.7%), while condos have surged the least (+5.2%). During the Housing Bust, prices in the low tier also collapsed by the most (-56%):
Today’s release of the Case-Shiller Index, “November,” is a rolling three-month average of closings that were entered into public records in August, September, and October.
This is “House-Price Inflation.”
By comparing the sales price of a house in the current month to the price of the same house when it sold previously, the Case-Shiller Index tracks the amount of dollars it takes to buy the same house going back decades, thereby measuring the purchasing power of the dollar with regards to houses. This “sales pairs” method (here is the methodology) makes the Case-Shiller Index a measure of “house-price inflation.”
So, consumer price inflation across the US as measured by CPI (which does not include house prices but includes rents) amounted to 55% since 2000, while house price inflation in the Los Angeles metro amounted to 215%, and house price inflation with regards to houses in the low tier, house price inflation since 2000 amounted to 285%!
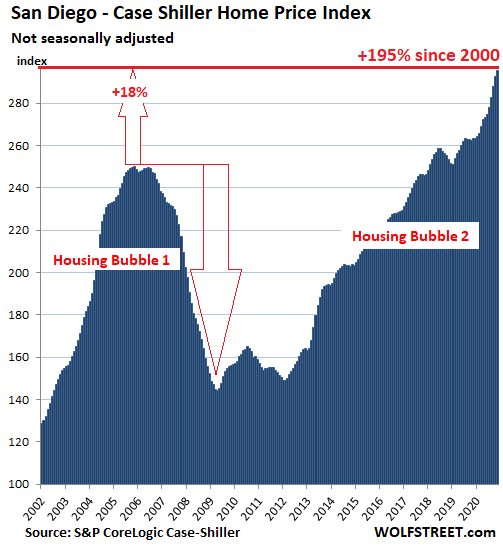
San Diego:
The Case-Shiller index for the San Diego metro rose by 0.9% in November from October and by 12.3% from a year ago. Prices have nearly tripled (+196%) since 2000:
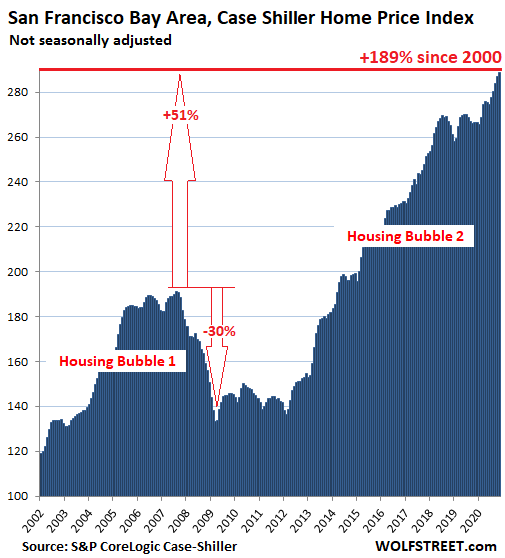
San Francisco Bay Area:
The Case-Shiller Index for “San Francisco” covers the Bay Area counties of San Francisco, San Mateo (northern part of Silicon Valley), Alameda and Contra Costa (East Bay), and Marin (North Bay). House prices rose 0.6% in November from October and were up 8.3% from a year ago. The index has nearly tripled since 2000 and is up 51% from the crazy peak of Housing Bubble 1:
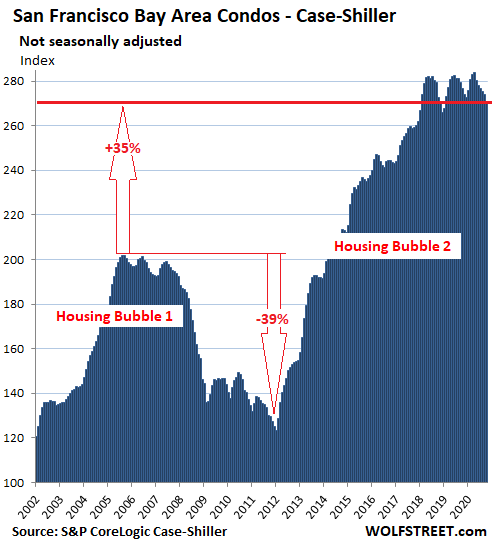
San Francisco Bay Area Condos:
Condo prices in the five-county Bay Area are another story – and the only exception on this list of the Great American Land Rush: they fell 1.1% in November from October, the sixth month in a row of declines, having fallen 4.5% since last May, and 2.1% from a year ago. They’re below where they’d first been in March 2018:
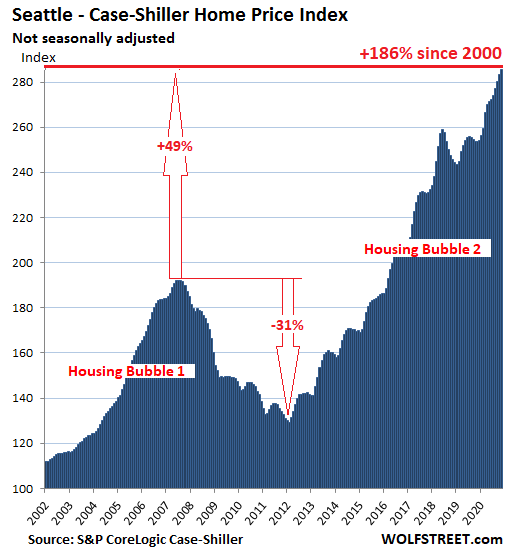
Seattle:
House prices in the Seattle metro rose by 0.9% in November from October and by 12.7% year-over-year. This makes Seattle the market with the second hottest annual house price inflation among the Splendid Housing Bubbles here, behind Phoenix (13.8%):
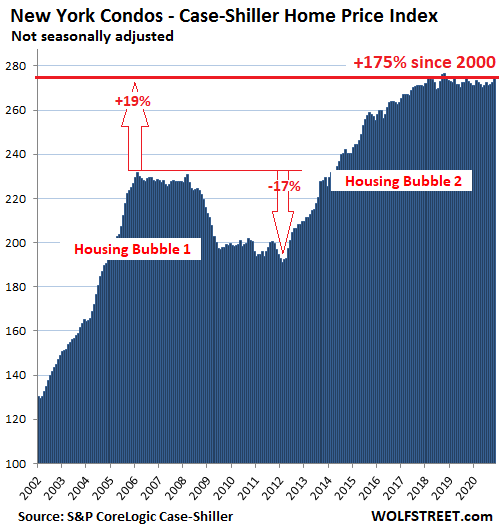
New York metro condos:
The Case-Shiller Index for New York City covers the vast and diverse market of New York City and numerous counties in the states of New York, New Jersey, and Connecticut. Condo prices in the area rose by 1.0% in November from October, having been essentially flat since late 2017:
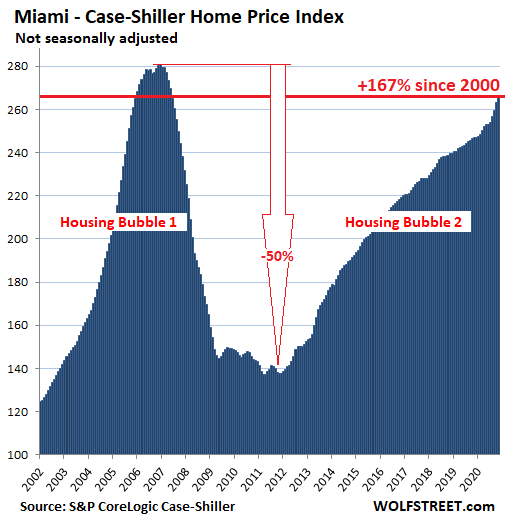
Miami:
House prices in the Miami metro jumped by 1.3% in November from October and by 7.9% year-over-year, and are now just 4.9% below the super-nutty peak of Housing Bubble 1:
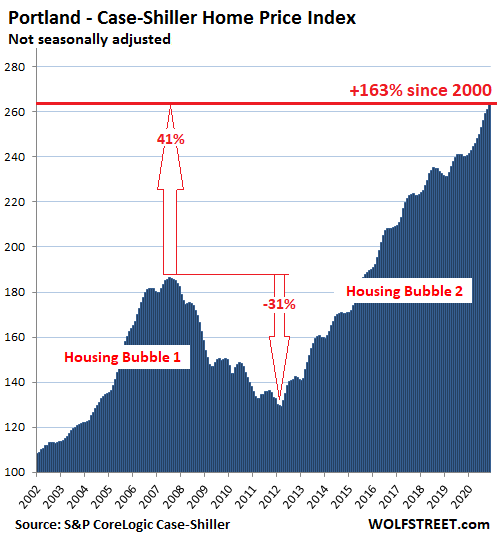
Portland:
House prices in the Portland metro rose 0.7% in October from September and 8.9% from a year earlier:
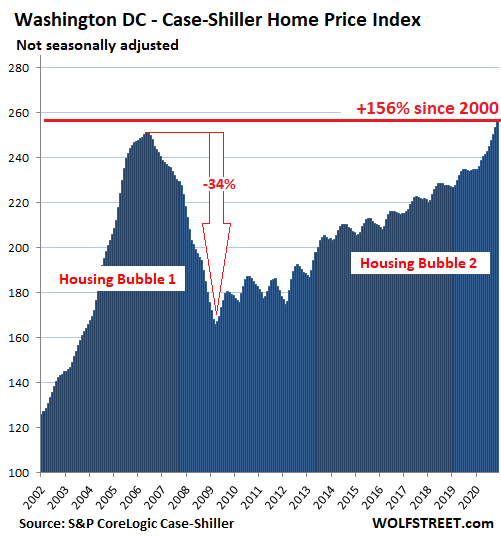
Washington D.C.:
House prices in the Washington D.C. metro rose 1.1% in November from October and were up 9.1% year-over-year and now have surpassed the insane peak of Housing Bubble 1 by 2.0%:
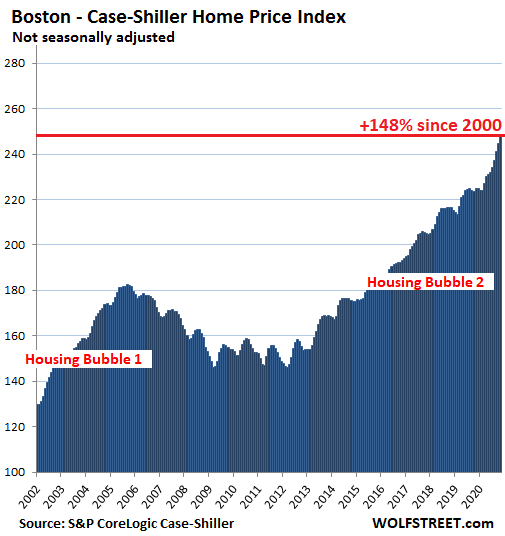
Boston:
House prices in the Boston metro rose 1.4% in November from October and by 10.4% year-over-year:
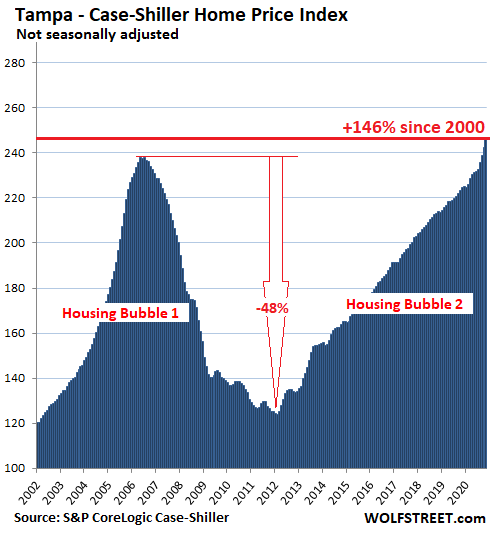
Tampa:
The Case Shiller Index for the Tampa metro jumped 1.4% in November from October and by 9.5% year-over-year, and thereby surpassed the crazy peak of Housing Bubble 1 by 3.3%:
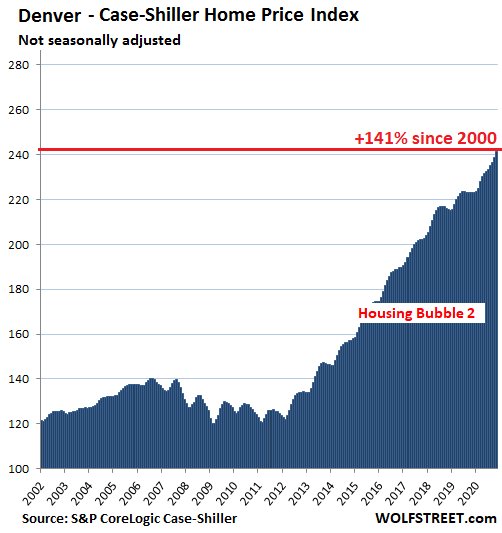
Denver:
House prices in the Denver metro rose 1.0% in November from October and by 8.0% year-over-year:
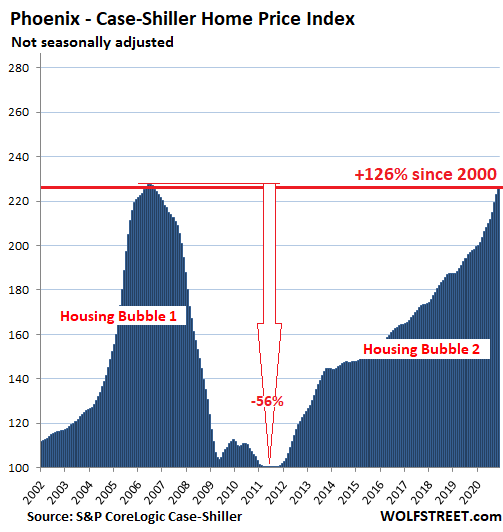
Phoenix:
House prices in the Phoenix metro jumped by 1.3% in November from October and by 13.8% year-over-year. This made Phoenix the market with the hottest annual house price inflation among the Splendid Housing Bubbles here, ahead of Seattle (12.7%) and San Diego (12.3%). And prices are now just about even with those at the peak of the crazy Housing Bubble 1:
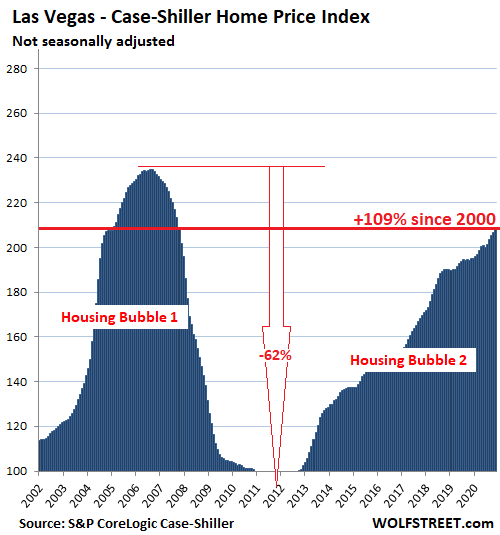
Las Vegas:
House prices in the Las Vegas metro rose 0.7% in November from October and 6.8% year-over-year:
Dallas:
The Case Shiller Index for the Dallas metro – counties of Collin, Dallas, Delta, Denton, Ellis, Hunt, Johnson, Kaufman, Parker, Rockwall, Tarrant, and Wise – rose 0.8% in November from October and by 7.2% year-over-year, and is up 107% from 2000.
In other words, in the Dallas metro, you have to pay over twice the dollars today that you had to pay 20 years ago to buy the same house. House price inflation since the year 2000 in the remaining cities on the 20-city Case Shiller Index has not yet ascended to this level, which makes Dallas the last entry on this list: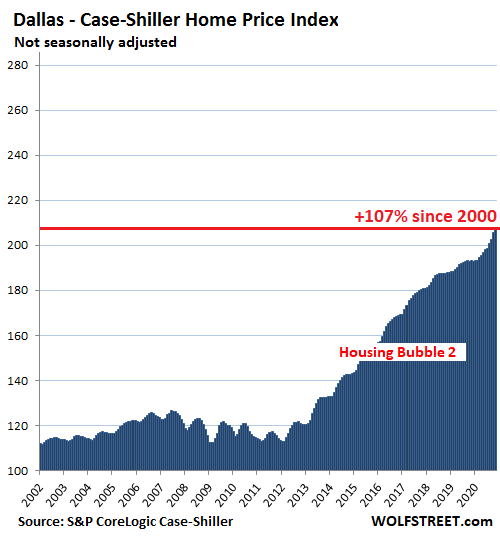
Enjoy reading WOLF STREET and want to support it? Using ad blockers – I totally get why – but want to support the site? You can donate. I appreciate it immensely. Click on the beer and iced-tea mug to find out how:

Would you like to be notified via email when WOLF STREET publishes a new article? Sign up here.
![]()


