
Rents jump in April | Yield PRO


The latest rent reports from Yardi Matrix and Apartment List show strongly positive rent growth for the country as-a-whole in April.
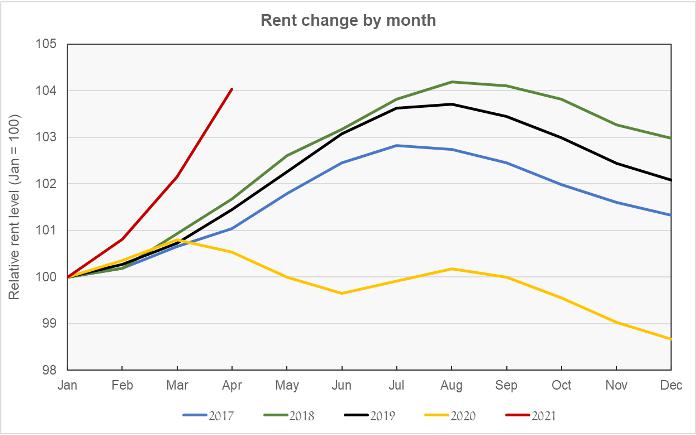
Rents up strongly
Yardi Matrix reported that the national average apartment rent rose $10 in April to $1,417. This was up 1.6 percent from its year-earlier level. Apartment List reported that the national average rent rose $21 for the month and was up 2.3 percent from its year-earlier level.
The rent growth season shifted into overdrive in April with the national average of rent increases outpacing those of recent years. The rate of increase in rents is the highest that Apartment List has seen since they started tracking it in 2017. The month-over-month increase in the average rent is the highest that Yardi Matrix has seen since July 2015.
The annual pattern of rent increases since January 2017 is shown in the chart, below, based on the data set from Apartment List. The data in the chart is normalized so that the January figure is always 100. This makes the year-to-year differences in the rates of rent growth more apparent. So far, 2021 is shaping up to be a record year for rent growth.
Not positive but less negative
The metros with the largest annual rent declines as ranked by Yardi Matrix are given in the table, below, along with the annual rent changes given for the metros in the two reports. Note however, that the boundaries of the metros being reported on are not exactly the same between the reports. For example, the Yardi Matrix report considers Los Angeles and Orange County to be separate metro areas while the Apartment List report considers them to be parts of one metro.
The recent trend of the gateway metros seeing the largest rent declines during the pandemic continued this month. The good news is that both reports found that the month-over-month rent changes for all of these markets was positive in April.
| Metro | Yardi Matrix | Apartment List |
| New York | -12.6 | -4.5 |
| San Jose | -10.8 | -13.0 |
| San Francisco | -7.7 | -11.8 |
| Seattle | -6.2 | -7.3 |
| Washington DC | -3.9 | -4.5 |
| Boston | -1.8 | -4.4 |
| Los Angeles | -1.4 | -1.0 |
| Chicago | -1.2 | -2.0 |
| Austin | -0.1 | -2.0 |
| Twin Cities | 0.1 | -2.1 |
The major metros with the largest year-over-year rent increases as determined by Yardi Matrix are listed in the next table, below, along with the year-over-year rent increases given for the metros in the two reports.
| Metro | Yardi Matrix | Apartment List |
| Inland Empire | 9.4 | 16.6* |
| Sacramento | 8.4 | 10.6 |
| Phoenix | 8.1 | 9.7 |
| Las Vegas | 7.6 | 9.7 |
| Atlanta | 6.2 | 7.4 |
| Tampa | 5.8 | 9.1 |
| Miami Metro | 4.5 | 5.0 |
| Baltimore | 4.4 | 6.0 |
| Indianapolis | 4.4 | 6.4 |
| Charlotte | 4.2 | 3.9 |
*Riverside-San Bernardino-Ontario
Rent convergence is real
The metros at the top of the list for rent growth are generally the same ones who topped the list prior to the pandemic. One thing that they have in common is that their average rent levels were significantly more affordable than were those of the coastal gateway markets prior to the pandemic. However, with rents have risen rapidly over the last year in the affordable metros while they are down in the expensive metros, the edge that the former have over the latter is shrinking. For example, in January 2020, the average rent in metro Los Angeles was 25 percent higher than that in the Inland Empire, according to Apartment List data. In April 2021, that differential closed to only 5.5 percent. In January 2020, rents in San Francisco were 52 percent higher than those in Sacramento. In April 2021, that differential closed to 22 percent. It will be interesting to see if the rent differential widens again when the gateway metros recover.
The Yardi Matrix report discussed the occupancy drops that have hit some metros in the last year. That was the subject of a more extensive report they issued earlier so it will not be covered again here.
The complete Yardi Matrix report discusses some of the smaller multifamily housing markets. It has more information about the larger markets including numbers on job growth and completions of new units. It also includes charts showing the history of rent changes in 18 of the top 30 markets over the last 4 years. It can be found here.
The complete Apartment List report covers many more metros and provides readers with the opportunity to download their data sets. It can be found here.


